Tag Archives: colorectal cancer

Colorectal Cancer Awareness Month

It’s Colorectal Cancer Awareness Month

Introduction

For colorectal cancer awareness month, we go behind the frequent calls for you to get screened. Let’s review the data and remind you why the disease itself is so devastating. This 2018 data is provided courtesy of the National Cancer Institute. They are based on statistics from SEER and the Centers for Disease Control and Prevention’s National Center for Health Statistics.

Cancer of the Colon and Rectum

Illustration of lower digestive system.
Anatomy of the Lower Digestive System 

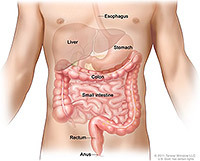
First things first: The digestive system is made up of the esophagus, stomach, and the small and large intestines. The first six feet of the large intestine are called the large bowel or colon. The last six inches are the rectum and the anal canal.

Cancer that begins in the colon is called colon cancer. When it begins in the rectum, it is called rectal cancer. Cancer that starts in either of these organs may also be called colorectal cancer.

How Common Is Colorectal Cancer?

Compared to other cancers, colorectal cancer is fairly common. It is the fourth ranked with respect to new cases. It is the second ranked in terms of deaths produced.

Rank Common Types of Cancer Estimated New
Cases 2018
Estimated
Deaths 2018
1. Breast Cancer (Female) 266,120 40,920
2. Lung and Bronchus Cancer 234,030 154,050
3. Prostate Cancer 164,690 29,430
4. Colorectal Cancer 140,250 50,630
5. Melanoma of the Skin 91,270 9,320
6. Bladder Cancer 81,190 17,240
7. Non-Hodgkin Lymphoma 74,680 19,910
8. Kidney and Renal Pelvis Cancer 65,340 14,970
9. Uterine Cancer 63,230 11,350
10. Leukemia 60,300 24,370

Colorectal cancer represents 8.1% of all new cancer cases in the U.S.

Colorectal cancer deaths

8.1%

For 2018, it was estimated that there would be 140,250 new cases of colorectal cancer and an estimated 50,630 people dying of this disease.

Prevalence of Colorectal Cancer

In 2015, there were an estimated 1,332,085 people living with colorectal cancer in the United States.

Number of New Cases and Deaths per 100,000

The number of new cases of colorectal cancer was 39.4 per 100,000 men and women per year. The number of deaths was 14.5 per 100,000 men and women per year. These rates are age-adjusted and based on 2011-2015 cases and deaths.

Lifetime Risk of Developing Cancer

Approximately 4.2 percent of men and women will be diagnosed with colorectal cancer at some point during their lifetime, based on 2013-2015 data.

Survival

How Many People Survive 5 Years Or More after Being Diagnosed with Colorectal Cancer?

Relative survival statistics compare the survival of patients diagnosed with cancer with the survival of people in the general population who are the same age, race, and sex and who have not been diagnosed with cancer. Because survival statistics are based on large groups of people, they cannot be used to predict exactly what will happen to an individual patient. No two patients are entirely alike, and treatment and responses to treatment can vary greatly.

64.5%

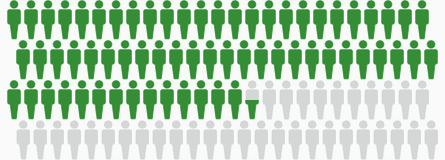
Percent Surviving 5 Years: 64.5%

Based on data from SEER 18 2008-2014. The gray figures represent those who have died from colorectal cancer. Green figures represent those who have survived 5 years or more.

Who Gets Colorectal Cancer?

Colorectal cancer is more common in men than women and among those of African American descent. The number of new cases of colorectal cancer was 39.4 per 100,000 men and women per year based on 2011-2015 cases.

Number of New Cases per 100,000 Persons by Race/Ethnicity & Sex: Colorectal Cancer

MALES
All Races 45.2
White 44.4
Black 55.5
Asian/Pacific Islander 39.3
American Indian/Alaska Native 45.1
Hispanic 39.7
Non-Hispanic 46.2
FEMALES
All Races 34.5
White 34.0
Black 41.9
Asian/Pacific Islander 28.0
American Indian/Alaska Native 39.2
Hispanic 28.6
Non-Hispanic 35.5

Percent of New Cases by Age Group: Colorectal Cancer

Age Range Percent of New Cases
<20 0.2%
20-34 1.6%
35-44 4.4%
45-54 15.0%
55-64 22.6%
65-74 24.3%
75-84 20.6%
>84 11.4%

Colorectal cancer is most frequently diagnosed among people aged 65-74.

Median Age At Diagnosis: 67

Survival: Who Dies From This Cancer?

For colorectal cancer, death rates increase with age. Colorectal cancer is the second leading cause of cancer death in the United States. The number of deaths was 14.5 per 100,000 men and women per year based on 2011-2015 deaths.

Number of Deaths per 100,000 Persons by Race/Ethnicity & Sex: Colorectal Cancer

MALES
All Races 17.3
White 16.8
Black 24.4
Asian/Pacific Islander 12.1
American Indian/Alaska Native 20.2
Hispanic 14.7
Non-Hispanic 17.6
FEMALES
All Races 12.2
White 11.9
Black 16.1
Asian/Pacific Islander 8.6
American Indian/Alaska Native 13.6
Hispanic 9.0
Non-Hispanic 12.5


Percent of Deaths by Age Group: Colorectal Cancer

Age Range Percent of Deaths
<20 0.0%
20-34 0.7%
35-44 2.6%
45-54 9.4%
55-64 18.6%
65-74 22.8%
75-84 24.8%
>84 21.0%

The percent of colorectal cancer deaths is highest among people aged 75-84.

Median Age At Death is 73

U.S. 2011-2015, All Races, Both Sexes

There’s More!

Read this Straight, No Chaser post on colorectal cancer screening. Please have this conversation with your physician. It could save your life.

Follow us!

Ask your SMA expert consultant any questions you may have on this topic. Also, take the #72HoursChallenge, and join the community. Additionally, as a thank you, we’re offering you a complimentary 30-day membership at www.72hourslife.com. Just use the code #NoChaser, and yes, it’s ok if you share!

Order your copy of Dr. Sterling’s books There are 72 Hours in a Day: Using Efficiency to Better Enjoy Every Part of Your Life and The 72 Hours in a Day Workbook: The Journey to The 72 Hours Life in 72 Days at Amazon or at www.jeffreysterlingbooks.com. Another free benefit to our readers is introductory pricing with multiple orders and bundles!

Thanks for liking and following Straight, No Chaser! This public service provides a sample of http://www.SterlingMedicalAdvice.com (SMA) and 844-SMA-TALK. Likewise, please share our page with your friends on WordPress! Also like us on Facebook @ SterlingMedicalAdvice.com! Follow us on Twitter at @asksterlingmd.

Copyright ©2013- 2019 · Sterling Initiatives, LLC · Powered by WordPress

Straight, No Chaser: Health Disparities

Disparities

In large part, this blog exists to inform individuals of all backgrounds about the risks that lead to abnormal health outcomes. Our hope is that once you discover the risks, you’ll be sufficiently equipped and incentivized to take the simple steps provided to improve your health.
Disparities are abnormal outcomes of a different variety. Disparities in healthcare lead to premature development of disease and death. The culprits are often insufficient access to care, culture barriers, habits and even discriminatory practices. It is critical for all involved, i.e., individuals, healthcare planners and practitioners, to understand these causes so that everyone can adjust habits and apply resources to combat this health hazard affecting both individuals and communities.
For the last 25 years of my career, I’ve had the unfortunate privilege of addressing this topic in national forums, including before the National Urban League, before the National Medical Association, recently, in the NAACP’s The Crisis magazine and in Straight, No Chaser to the extent that our service provides you with the information that can make a difference in your lives. Unfortunately for some, it’s almost never that easy.

 disparities_infant-mortality

As a statement of fact, according to the latest Center for Disease Control and Prevention (CDC) Health Disparities & Inequalities Report,  African-Americans suffer global health disparities that result in the following outcomes.

  • Life expectancy: In 2011, the average American could expect to live 78.7 years. The average African-American could only expect to live 75.3 years, compared with 78.8 years for the average White American.
  • Death rates: In 2009, African-Americans had the highest death rates from homicide among all racial and ethnic populations. Rates among African-American males were the highest for males across all age groups.
  • Infant mortality rates: In 2008, infants of African-American women had the highest death rate among American infants with a rate more than twice as high as infants of white women.

 disparitydm

The following disparities were also reported:

  • Heart disease and stroke: In 2009, African-Americans had the largest death rates from heart disease and stroke compared with other racial and ethnic populations, with disparities across all age groups younger than 85 years of age.
  • High blood pressure: From 2007-2010, the prevalence of hypertension was among adults aged 65 years and older, African-American adults, US-born adults, adults with less than a college education, adults who received public health insurance (18-64 years old) and those with diabetes, obesity or a disability compared with their counterparts. The percentages of African-Americans and Hispanics who had control of high blood pressure were lower compared to white adults.
  • Obesity: From 2007-2010, the prevalence of obesity among adults was highest among African-American women compared with white and Mexican American women and men. Obesity prevalence among African-American adults was the largest compared to other race ethnicity groups.
  • Diabetes: In 2010, the prevalence of diabetes among African-American adults was nearly twice as large as that for white adults.
  • Activity limitations caused by chronic conditions: From 1999-2008, the number of years of expected life free of activity limitations caused by chronic conditions is disproportionately higher for African-American adults than whites.
  • Periodontitis: In 2009-2010, the prevalence of periodontitis (a form of dental disease) was greatest among African-American and Mexican American adults compared with white adults.
  • HIV: In 2010, African-American adults had the largest HIV infection rate compared with rates among other racial and ethnic populations. Prescribed HIV treatment among African-American adults living with HIV was less than among white adults.
  • Access to care: In 2010, Hispanic and African-American adults aged 18-64 years had larger percentages without health insurance compared with white and Asian/Pacific Islander counterparts.
  • Colorectal cancer: In 2008, African Americans had the largest incidence and death rates from colorectal cancer of all racial and ethnic populations despite similar colorectal screening rates compared to white adults.
  • Influenza vaccination: During the 2010-11 influenza season, influenza vaccination coverage was similar for African-American and white children aged six months to 17 years but lower among African-American adults compared with white adults.
  • Socioeconomic factors: In 2011, similar to other minority adults aged 25 years or older, a larger percentage of African-American adults did not complete high school compared with white adults. A larger percentage of African American adults also lived below the poverty level and were unemployed (adults aged 18-64 years) compared with white adults of the same age.

disparityuninsured

Identifying disparities is a good start. However, to reduce them it is necessary to identify and implement solutions, both individually and institutionally. To this end, we will explore best practices in future Straight, No Chaser posts.

Feel free to ask your SMA expert consultant any questions you may have on this topic.
Take the #72HoursChallenge, and join the community. As a thank you for being a valued subscriber to Straight, No Chaser, we’d like to offer you a complimentary 30-day membership at www.72hourslife.com. Just use the code #NoChaser, and yes, it’s ok if you share!
Order your copy of Dr. Sterling’s new books There are 72 Hours in a Day: Using Efficiency to Better Enjoy Every Part of Your Life and The 72 Hours in a Day Workbook: The Journey to The 72 Hours Life in 72 Days at Amazon or at www.72hourslife.com. Receive introductory pricing with orders!
Thanks for liking and following Straight, No Chaser! This public service provides a sample of what http://www.SterlingMedicalAdvice.com (SMA) and 844-SMA-TALK offers. Please share our page with your friends on WordPress, like us on Facebook SterlingMedicalAdvice.com and follow us on Twitter at @asksterlingmd.
Copyright © 2018 · Sterling Initiatives, LLC · Powered by WordPress

Processed Meats Cause Cancer

Introduction

This Straight, No Chaser post discusses the links between processed meats and cancer.

processed meats cause cancer

Perhaps this should be filed under things you already know, think you know, or know but don’t care enough for it to change your lifestyle (we are a bacon-loving nation), but at least after reading this, you can consider yourself an informed consumer.
bacon-wrapped-hot-dog-maple-bar

What’s the news?

The World Health Organization has reaffirmed that processed (and cured) meats cause colorectal cancer. This places these foods in the same category of danger as smoking, alcohol intake and asbestos exposure. Furthermore, red meats such as beef, lamb and pork have been upgraded to “probable” carcinogens, which means the research is mounting in that direction but isn’t yet definitive.
bacon cigarettes

Which meats pose the danger?

Bacon, ham, hot dogs and sausage, as well as processed meats like salamis and cold cuts.

Red-Meat-1

Can I trust this information?

You should. These recommendations were based on data from over 800 different research studies.

Is this an example of “everything in moderation is ok?” Doesn’t everything cause cancer?

If you want to believe that, fine. It’s more accurate to say there are levels of risk at every amount of consumption. However, to quantify the risk for this topic, approximately 3 slices of cooked bacon eaten daily was shown to increase the risk for colorectal (bowel) cancer by 18%. The average American eats about 18 pounds of bacon per year, well above that standard. The difference here is this level of consumption is well within the normal eating habits of Americans, as opposed to theoretical consumptions that aren’t practically realized due to insufficient lifetime exposure.

hotdogeating


Follow us!

Ask your SMA expert consultant any questions you may have on this topic. Also, take the #72HoursChallenge, and join the community. Additionally, as a thank you, we’re offering you a complimentary 30-day membership at www.72hourslife.com. Just use the code #NoChaser, and yes, it’s ok if you share!

Order your copy of Dr. Sterling’s books There are 72 Hours in a Day: Using Efficiency to Better Enjoy Every Part of Your Life and The 72 Hours in a Day Workbook: The Journey to The 72 Hours Life in 72 Days at Amazon or at www.jeffreysterlingbooks.com. Another free benefit to our readers is introductory pricing with multiple orders and bundles!

Thanks for liking and following Straight, No Chaser! This public service provides a sample of http://www.SterlingMedicalAdvice.com (SMA) and 844-SMA-TALK. Likewise, please share our page with your friends on WordPress! Also like us on Facebook SterlingMedicalAdvice.com! Follow us on Twitter at @asksterlingmd.

Copyright © 2019 · Sterling Initiatives, LLC · Powered by WordPress

Straight, No Chaser: Healthcare Disparities

Disparities

In large part, this blog exists to inform individuals of all backgrounds about the risks that lead to abnormal health outcomes. Our hope is that once you discover the risks, you’ll be sufficiently equipped and incentivized to take the simple steps provided to improve your health.
Disparities are abnormal outcomes of a different variety. Disparities in healthcare lead to premature development of disease and death. The culprits are often insufficient access to care, culture barriers, habits and even discriminatory practices. It is critical for all involved, i.e., individuals, healthcare planners and practitioners, to understand these causes so that everyone can adjust habits and apply resources to combat this health hazard affecting both individuals and communities.
For the last 25 years of my career, I’ve had the unfortunate privilege of addressing this topic in national forums, including before the National Urban League, before the National Medical Association, recently, in the NAACP’s The Crisis magazine and in Straight, No Chaser to extent that our service provides you with the information that can make a difference in your lives. Unfortunately for some, it’s almost never that easy.

 disparities_infant-mortality

As a statement of fact, according to the Center for Disease Control and Prevention (CDC) Health Disparities & Inequalities Report 
of 2013, African-Americans suffer global health disparities that result in the following outcomes.

  • Life expectancy: In 2011, the average American could expect to live 78.7 years. The average African-American could only expect to live 75.3 years, compared with 78.8 years for the average White American.
  • Death rates: In 2009, African-Americans had the highest death rates from homicide among all racial and ethnic populations. Rates among African-American males were the highest for males across all age groups.
  • Infant mortality rates: In 2008, infants of African-American women had the highest death rate among American infants with a rate more than twice as high as infants of white women.

 disparitydm

The following disparities were also reported:

  • Heart disease and stroke: In 2009, African-Americans had the largest death rates from heart disease and stroke compared with other racial and ethnic populations, with disparities across all age groups younger than 85 years of age.
  • High blood pressure: From 2007-2010, the prevalence of hypertension was among adults aged 65 years and older, African-American adults, US-born adults, adults with less than a college education, adults who received public health insurance (18-64 years old) and those with diabetes, obesity or a disability compared with their counterparts. The percentages of African-Americans and Hispanics who had control of high blood pressure were lower compared to white adults.
  • Obesity: From 2007-2010, the prevalence of obesity among adults was highest among African-American women compared with white and Mexican American women and men. Obesity prevalence among African-American adults was the largest compared to other race ethnicity groups.
  • Diabetes: In 2010, the prevalence of diabetes among African-American adults was nearly twice as large as that for white adults.
  • Activity limitations caused by chronic conditions: From 1999-2008, the number of years of expected life free of activity limitations caused by chronic conditions is disproportionately higher for African-American adults than whites.
  • Periodontitis: In 2009-2010, the prevalence of periodontitis (a form of dental disease) was greatest among African-American and Mexican American adults compared with white adults.
  • HIV: In 2010, African-American adults had the largest HIV infection rate compared with rates among other racial and ethnic populations. Prescribed HIV treatment among African-American adults living with HIV was less than among white adults.
  • Access to care: In 2010, Hispanic and African-American adults aged 18-64 years had larger percentages without health insurance compared with white and Asian/Pacific Islander counterparts.
  • Colorectal cancer: In 2008, African-Americans had the largest incidence and death rates from colorectal cancer of all racial and ethnic populations despite similar colorectal screening rates compared to white adults.
  • Influenza vaccination: During the 2010-11 influenza season, influenza vaccination coverage was similar for African-American and white children aged six months to 17 years but lower among African-American adults compared with white adults.
  • Socioeconomic factors: In 2011, similar to other minority adults aged 25 years or older, a larger percentage of African-American adults did not complete high school compared with white adults. A larger percentage of African-American adults also lived below the poverty level and were unemployed (adults aged 18-64 years) compared with white adults of the same age.

disparityuninsured

Identifying disparities is a good start. However, to reduce them it is necessary to identify and implement solutions, both individually and institutionally. To this end, we will explore best practices in future Straight, No Chaser posts. Feel free to ask any questions you have on this topic.

Feel free to ask your SMA expert consultant any questions you may have on this topic.
Take the #72HoursChallenge, and join the community. As a thank you for being a valued subscriber to Straight, No Chaser, we’d like to offer you a complimentary 30-day membership at www.72hourslife.com. Just use the code #NoChaser, and yes, it’s ok if you share!
Order your copy of Dr. Sterling’s new books There are 72 Hours in a Day: Using Efficiency to Better Enjoy Every Part of Your Life and The 72 Hours in a Day Workbook: The Journey to The 72 Hours Life in 72 Days at Amazon or at www.72hourslife.com. Receive introductory pricing with orders!
Thanks for liking and following Straight, No Chaser! This public service provides a sample of what http://www.SterlingMedicalAdvice.com (SMA) and 844-SMA-TALK offers. Please share our page with your friends on WordPress, like us on Facebook SterlingMedicalAdvice.com and follow us on Twitter at @asksterlingmd.
Copyright © 2017 · Sterling Initiatives, LLC · Powered by WordPress
 

Straight, No Chaser Reminder: Processed Meats Cause Cancer

processed-meats-cause-cancer

Perhaps this should be filed under things you already know, think you know, or know but don’t care enough for it to change your lifestyle (we are a bacon-loving nation), but at least after reading this, you can consider yourself an informed consumer.
bacon-wrapped-hot-dog-maple-bar
What’s the news? The World Health Organization has reaffirmed that processed (and cured) meats cause colorectal cancer. This places these foods in the same category of danger as smoking, alcohol intake and asbestos exposure. Furthermore, red meats such as beef, lamb and pork have been upgraded to “probable” carcinogens, which means the research is mounting in that direction but isn’t yet definitive.
bacon cigarettes
Which meats pose the danger? Bacon, ham, hot dogs and sausage, as well as processed meats like salamis and cold cuts.

Red-Meat-1

Can I trust this information? You should. These recommendations were based on data from over 800 different research studies.
Is this an example of “everything in moderation is ok?” Doesn’t everything cause cancer? If you want to believe that, fine. It’s more accurate to say there are levels of risk at every amount of consumption. However, to quantify the risk for this topic, approximately 3 slices of cooked bacon eaten daily was shown to increase the risk for colorectal (bowel) cancer by 18%. The average American eats about 18 pounds of bacon per year, well above that standard. The difference here is this level of consumption is well within the normal eating habits of Americans, as opposed to theoretical consumptions that aren’t practically realized due to insufficient lifetime exposure.

hotdogeating

Feel free to ask your SMA expert consultant any questions you may have on this topic.
Order your copy of Dr. Sterling’s new book Behind The Curtain: A Peek at Life from within the ER at jeffreysterlingbooks.com, iTunes, Amazon, Barnes and Nobles and wherever books are sold.
Thanks for liking and following Straight, No Chaser! This public service provides a sample of what http://www.SterlingMedicalAdvice.com (SMA) and 844-SMA-TALK offers. Please share our page with your friends on WordPress, like us on Facebook SterlingMedicalAdvice.com and follow us on Twitter at @asksterlingmd.
Copyright © 2016 · Sterling Initiatives, LLC · Powered by WordPress

Straight, No Chaser: Healthcare Disparities

Disparities

In large part, this blog exists to inform individuals of all backgrounds about the risks that lead to abnormal health outcomes. Our hope is that once you discover the risks, you’ll be sufficiently equipped and incentivized to take the simple steps provided to improve your health.
Disparities are abnormal outcomes of a different variety. Disparities in healthcare lead to premature development of disease and death. The culprits are often insufficient access to care, culture barriers, habits and even discriminatory practices. It is critical for all involved, i.e., individuals, healthcare planners and practitioners, to understand these causes so that everyone can adjust habits and apply resources to combat this health hazard affecting both individuals and communities.
For the last 25 years of my career, I’ve had the unfortunate privilege of addressing this topic in national forums, including before the National Urban League, before the National Medical Association, recently, in the NAACP’s The Crisis magazine and in Straight, No Chaser to extent that our service provides you with the information that can make a difference in your lives. Unfortunately for some, it’s almost never that easy.

 disparities_infant-mortality

As a statement of fact, according to the Center for Disease Control and Prevention (CDC) Health Disparities & Inequalities Report 
of 2013, African-Americans suffer global health disparities that result in the following outcomes.

  • Life expectancy: In 2011, the average American could expect to live 78.7 years. The average African-American could only expect to live 75.3 years, compared with 78.8 years for the average White American.
  • Death rates: In 2009, African-Americans had the highest death rates from homicide among all racial and ethnic populations. Rates among African-American males were the highest for males across all age groups.
  • Infant mortality rates: In 2008, infants of African-American women had the highest death rate among American infants with a rate more than twice as high as infants of white women.

 disparitydm

The following disparities were also reported:

  • Heart disease and stroke: In 2009, African-Americans had the largest death rates from heart disease and stroke compared with other racial and ethnic populations, with disparities across all age groups younger than 85 years of age.
  • High blood pressure: From 2007-2010, the prevalence of hypertension was among adults aged 65 years and older, African-American adults, US-born adults, adults with less than a college education, adults who received public health insurance (18-64 years old) and those with diabetes, obesity or a disability compared with their counterparts. The percentages of African-Americans and Hispanics who had control of high blood pressure were lower compared to white adults.
  • Obesity: From 2007-2010, the prevalence of obesity among adults was highest among African-American women compared with white and Mexican American women and men. Obesity prevalence among African-American adults was the largest compared to other race ethnicity groups.
  • Diabetes: In 2010, the prevalence of diabetes among African-American adults was nearly twice as large as that for white adults.
  • Activity limitations caused by chronic conditions: From 1999-2008, the number of years of expected life free of activity limitations caused by chronic conditions is disproportionately higher for African-American adults than whites.
  • Periodontitis: In 2009-2010, the prevalence of periodontitis (a form of dental disease) was greatest among African-American and Mexican American adults compared with white adults.
  • HIV: In 2010, African-American adults had the largest HIV infection rate compared with rates among other racial and ethnic populations. Prescribed HIV treatment among African-American adults living with HIV was less than among white adults.
  • Access to care: In 2010, Hispanic and African-American adults aged 18-64 years had larger percentages without health insurance compared with white and Asian/Pacific Islander counterparts.
  • Colorectal cancer: In 2008, African-Americans had the largest incidence and death rates from colorectal cancer of all racial and ethnic populations despite similar colorectal screening rates compared to white adults.
  • Influenza vaccination: During the 2010-11 influenza season, influenza vaccination coverage was similar for African-American and white children aged six months to 17 years but lower among African-American adults compared with white adults.
  • Socioeconomic factors: In 2011, similar to other minority adults aged 25 years or older, a larger percentage of African-American adults did not complete high school compared with white adults. A larger percentage of African-American adults also lived below the poverty level and were unemployed (adults aged 18-64 years) compared with white adults of the same age.

disparityuninsured

Identifying disparities is a good start. However, to reduce them it is necessary to identify and implement solutions, both individually and institutionally. To this end, we will explore best practices in future Straight, No Chaser posts. Feel free to ask any questions you have on this topic.

Feel free to ask your SMA expert consultant any questions you may have on this topic.
Order your copy of Dr. Sterling’s new book Behind The Curtain: A Peek at Life from within the ER at jeffreysterlingbooks.com, iTunes, Amazon, Barnes and Nobles and wherever books are sold.
Thanks for liking and following Straight, No Chaser! This public service provides a sample of what http://www.SterlingMedicalAdvice.com (SMA) and 844-SMA-TALK offers. Please share our page with your friends on WordPress, like us on Facebook SterlingMedicalAdvice.com and follow us on Twitter at @asksterlingmd.
Copyright © 2016 · Sterling Initiatives, LLC · Powered by WordPress

Straight, No Chaser In The News: Your Questions About Processed Meats Causing Cancer

processed-meats-cause-cancer

Perhaps this news will be filed under things you already know, think you know, or know but don’t care enough for it to change your lifestyle (we are a bacon-loving nation), but at least after reading this, you can consider yourself an informed consumer.
bacon-wrapped-hot-dog-maple-bar
What’s the news? The World Health Organization has reaffirmed that processed (and cured) meats cause colorectal cancer. This places these foods in the same category of danger as smoking, alcohol intake and asbestos exposure. Furthermore, red meats such as beef, lamb and pork have been upgraded to “probable” carcinogens, which means the research is mounting in that direction but isn’t yet definitive.
bacon cigarettes
Which meats pose the danger? Bacon, ham, hot dogs and sausage, as well as processed meats like salamis and cold cuts.

Red-Meat-1

 
Can I trust this information? You should. These recommendations were based on data from over 800 different research studies.
Is this an example of “everything in moderation is ok?” Doesn’t everything cause cancer? If you want to believe that, fine. It’s more accurate to say there are levels of risk at every amount of consumption. However, to quantify the risk for this topic, approximately 3 slices of cooked bacon eaten daily was shown to increase the risk for colorectal (bowel) cancer by 18%. The average American eats about 18 pounds of bacon per year, well above that standard. The difference here is this level of consumption is well within the normal eating habits of Americans, as opposed to theoretical consumptions that aren’t practically realized due to insufficient lifetime exposure.

hotdogeating

Order your copy of Dr. Sterling’s new book Behind The Curtain: A Peek at Life from within the ER at jeffreysterlingbooks.com, iTunes, AmazonBarnes and Nobles and wherever books are sold.
Thanks for liking and following Straight, No Chaser! This public service provides a sample of what http://www.SterlingMedicalAdvice.com (SMA) and 844-SMA-TALK offers. Please share our page with your friends on WordPress, like us on Facebook SterlingMedicalAdvice.com and follow us on Twitter at @asksterlingmd.
 

Straight, No Chaser: Healthcare Disparities

Disparities

In large part, this blog exists to inform individuals of all backgrounds about the risks that lead to abnormal health outcomes. Our hope is that once you discover the risks, you’ll be sufficiently equipped and incentivized to take the simple steps provided to improve your health.
Disparities are abnormal outcomes of a different variety. Disparities in healthcare lead to premature development of disease and death. The culprits are often insufficient access to care, culture barriers, habits and even discriminatory practices. It is critical for all involved, i.e., individuals, healthcare planners and practitioners, to understand these causes so that everyone can adjust habits and apply resources to combat this health hazard affecting both individuals and communities.
For the last 25 years of my career, I’ve had the unfortunate privilege of addressing this topic in national forums, including before the National Urban League, before the National Medical Association, recently, in the NAACP’s The Crisis magazine and in Straight, No Chaser to extent that our service provides you with the information that can make a difference in your lives. Unfortunately for some, it’s almost never that easy.

 disparities_infant-mortality

As a statement of fact, according to the Center for Disease Control and Prevention (CDC) Health Disparities & Inequalities Report 
of 2013, African-Americans suffer global health disparities that result in the following outcomes.

  • Life expectancy: In 2011, the average American could expect to live 78.7 years. The average African-American could only expect to live 75.3 years, compared with 78.8 years for the average White American.
  • Death rates: In 2009, African-Americans had the highest death rates from homicide among all racial and ethnic populations. Rates among African-American males were the highest for males across all age groups.
  • Infant mortality rates: In 2008, infants of African-American women had the highest death rate among American infants with a rate more than twice as high as infants of white women.

 disparitydm

The following disparities were also reported:

  • Heart disease and stroke: In 2009, African-Americans had the largest death rates from heart disease and stroke compared with other racial and ethnic populations, with disparities across all age groups younger than 85 years of age.
  • High blood pressure: From 2007-2010, the prevalence of hypertension was among adults aged 65 years and older, African-American adults, US-born adults, adults with less than a college education, adults who received public health insurance (18-64 years old) and those with diabetes, obesity or a disability compared with their counterparts. The percentages of African-Americans and Hispanics who had control of high blood pressure were lower compared to white adults.
  • Obesity: From 2007-2010, the prevalence of obesity among adults was highest among African-American women compared with white and Mexican American women and men. Obesity prevalence among African-American adults was the largest compared to other race ethnicity groups.
  • Diabetes: In 2010, the prevalence of diabetes among African-American adults was nearly twice as large as that for white adults.
  • Activity limitations caused by chronic conditions: From 1999-2008, the number of years of expected life free of activity limitations caused by chronic conditions is disproportionately higher for African-American adults than whites.
  • Periodontitis: In 2009-2010, the prevalence of periodontitis (a form of dental disease) was greatest among African-American and Mexican American adults compared with white adults.
  • HIV: In 2010, African-American adults had the largest HIV infection rate compared with rates among other racial and ethnic populations. Prescribed HIV treatment among African-American adults living with HIV was less than among white adults.
  • Access to care: In 2010, Hispanic and African-American adults aged 18-64 years had larger percentages without health insurance compared with white and Asian/Pacific Islander counterparts.
  • Colorectal cancer: In 2008, African Americans had the largest incidence and death rates from colorectal cancer of all racial and ethnic populations despite similar colorectal screening rates compared to white adults.
  • Influenza vaccination: During the 2010-11 influenza season, influenza vaccination coverage was similar for African-American and white children aged six months to 17 years but lower among African-American adults compared with white adults.
  • Socioeconomic factors: In 2011, similar to other minority adults aged 25 years or older, a larger percentage of African-American adults did not complete high school compared with white adults. A larger percentage of African American adults also lived below the poverty level and were unemployed (adults aged 18-64 years) compared with white adults of the same age.

disparityuninsured

Identifying disparities is a good start. However, to reduce them it is necessary to identify and implement solutions, both individually and institutionally. To this end, we will explore best practices in future Straight, No Chaser posts. Feel free to ask any questions you have on this topic.

This public service provides a sample of what http://www.SterlingMedicalAdvice.com (SMA) and 844-SMA-TALK (844-762-8255) offers. Please share our page with your friends on WordPress, Facebook @ SterlingMedicalAdvice.com and Twitter at @asksterlingmd. Please like and share our blog with your family and friends. We’re here for you 24/7 with immediate, personalized information and advice. Contact your Personal Healthcare Consultant at http://www.SterlingMedicalAdvice.com or 1-844-SMA-TALK.

Copyright © 2015 · Sterling Initiatives, LLC · Powered by WordPress

Straight, No Chaser: Health Disparities

Disparities

In large part, this blog exists to inform individuals of all backgrounds about the risks that lead to abnormal health outcomes. Our hope is that once you discover the risks, you’ll be sufficiently equipped and incentivized to take the simple steps provided to improve your health.
Disparities are abnormal outcomes of a different variety. Disparities in healthcare lead to premature development of disease and death. The culprits are often insufficient access to care, culture barriers, habits and even discriminatory practices. It is critical for all involved, i.e., individuals, healthcare planners and practitioners, to understand these causes so that everyone can adjust habits and apply resources to combat this health hazard affecting both individuals and communities.
For the last 25 years of my career, I’ve had the unfortunate privilege of addressing this topic in national forums, including before the National Urban League, before the National Medical Association, recently, in the NAACP’s The Crisis magazine and in Straight, No Chaser to extent that our service provides you with the information that can make a difference in your lives. Unfortunately for some, it’s almost never that easy.

 disparities_infant-mortality

As a statement of fact, according to the Center for Disease Control and Prevention (CDC) Health Disparities & Inequalities Report 
of 2013, African-Americans suffer global health disparities that result in the following outcomes.

  • Life expectancy: In 2011, the average American could expect to live 78.7 years. The average African-American could only expect to live 75.3 years, compared with 78.8 years for the average White American.
  • Death rates: In 2009, African-Americans had the highest death rates from homicide among all racial and ethnic populations. Rates among African-American males were the highest for males across all age groups.
  • Infant mortality rates: In 2008, infants of African-American women had the highest death rate among American infants with a rate more than twice as high as infants of white women.

 disparitydm

The following disparities were also reported:

  • Heart disease and stroke: In 2009, African-Americans had the largest death rates from heart disease and stroke compared with other racial and ethnic populations, with disparities across all age groups younger than 85 years of age.
  • High blood pressure: From 2007-2010, the prevalence of hypertension was among adults aged 65 years and older, African-American adults, US-born adults, adults with less than a college education, adults who received public health insurance (18-64 years old) and those with diabetes, obesity or a disability compared with their counterparts. The percentages of African-Americans and Hispanics who had control of high blood pressure were lower compared to white adults.
  • Obesity: From 2007-2010, the prevalence of obesity among adults was highest among African-American women compared with white and Mexican American women and men. Obesity prevalence among African-American adults was the largest compared to other race ethnicity groups.
  • Diabetes: In 2010, the prevalence of diabetes among African-American adults was nearly twice as large as that for white adults.
  • Activity limitations caused by chronic conditions: From 1999-2008, the number of years of expected life free of activity limitations caused by chronic conditions is disproportionately higher for African-American adults than whites.
  • Periodontitis: In 2009-2010, the prevalence of periodontitis (a form of dental disease) was greatest among African-American and Mexican American adults compared with white adults.
  • HIV: In 2010, African-American adults had the largest HIV infection rate compared with rates among other racial and ethnic populations. Prescribed HIV treatment among African-American adults living with HIV was less than among white adults.
  • Access to care: In 2010, Hispanic and African-American adults aged 18-64 years had larger percentages without health insurance compared with white and Asian/Pacific Islander counterparts.
  • Colorectal cancer: In 2008, African Americans had the largest incidence and death rates from colorectal cancer of all racial and ethnic populations despite similar colorectal screening rates compared to white adults.
  • Influenza vaccination: During the 2010-11 influenza season, influenza vaccination coverage was similar for African-American and white children aged six months to 17 years but lower among African-American adults compared with white adults.
  • Socioeconomic factors: In 2011, similar to other minority adults aged 25 years or older, a larger percentage of African-American adults did not complete high school compared with white adults. A larger percentage of African American adults also lived below the poverty level and were unemployed (adults aged 18-64 years) compared with white adults of the same age.

disparityuninsured

Identifying disparities is a good start. However, to reduce them it is necessary to identify and implement solutions, both individually and institutionally. To this end, we will explore best practices in future Straight, No Chaser posts. Feel free to ask any questions you have on this topic.

This public service provides a sample of what http://www.SterlingMedicalAdvice.com (SMA) and 844-SMA-TALK (844-762-8255) offers. Please share our page with your friends on WordPress, Facebook @ SterlingMedicalAdvice.com and Twitter at @asksterlingmd. Please like and share our blog with your family and friends. We’re here for you 24/7 with immediate, personalized information and advice. Contact your Personal Healthcare Consultant at http://www.SterlingMedicalAdvice.com or 1-844-SMA-TALK.

Copyright © 2014 · Sterling Initiatives, LLC · Powered by WordPress